


We now have almost two years of evidence of the impact of the tax cuts signed into law by President Donald Trump in December 2017. The picture is grim. None of the touted benefits has eventuated. Alan Austin reports.
The plan was to give consumers more money to spend, thus boosting business activity starting with retail sales. This would flow through to wholesale, transport and other sectors generating greater productivity, profits, wages and, eventually, huge tax revenue.
Of the 17 key indicators of success, only three have improved over previous periods in recent US history. But all three have deteriorated relative to the rest of the world. The other 14 have collapsed, many of them disastrously, relative both to earlier periods and comparable countries.
Let’s go through them, with hotlinked data sources, starting with the positives.
Overall job creation
The decline in the jobless rate in November from 3.57% down to the 50-year low of 3.53% is welcome. But it is not great, given the current global surge in investment, trade, profits and employment. Jobs are being created at record rates worldwide. At least 30 economies are now at all-time jobless lows, not just 50-year lows.
Last month, the jobless rate fell in the Philippines from 5.4% to 4.5% and in Israel from 3.6% to 3.4%. Percentage declines elsewhere included Nicaragua down from 6.2 to 5.2, Estonia from 5.1 to 3.9, Guatemala from 2.8 to 2.0 and Myanmar from 2.2 to 1.6. All are better than the US, all the result of prevailing buoyant global conditions. Nothing to do with tax cuts or any individual heroic leader.
In fact, US ranking in the world on jobless rates actually fell last month from 44th down to 46th, out of 180 countries.
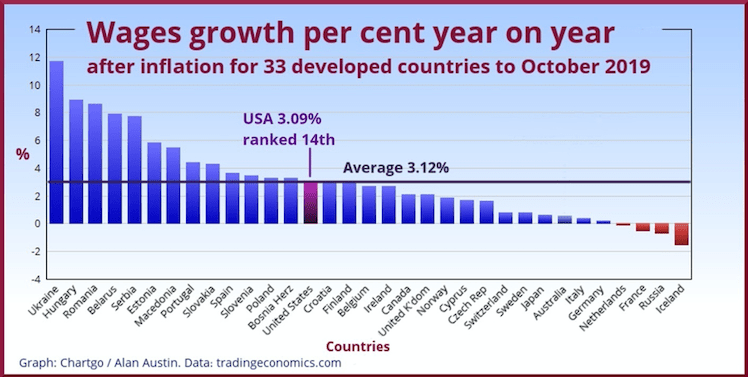
Wage rises
The lift in wages through 2019 is also welcome. But the US no longer leads the world. Trading Economics shows average real wages growth for 33 developed countries at 3.12%. The US ranks 14th with 3.09%.
Personal savings
Through 2017, Americans saved around 6.8% of their disposable income. This increased through 2018, peaking at 8.8% in early 2019. It was 7.8% when last reported in October.
Again, this is nowhere near world’s best, ranking 24th among the 35 economies listed at Trading Economics.
So those are the three positives. Not bad, but not brilliant. Now to the negatives.
Consumer spending
Personal expenditure increased in the September quarter by just 2.50% over the same quarter a year ago. This is historically very low, and disturbing given the global upswing in jobs, incomes and consumer spending. We have to go back to the global financial crisis (GFC) to find a lower September spending rise.
Retail sales receding
Total retail sales in October were just 3.1% higher than in October last year. That is the second worst October result since the onset of the GFC in 2009. The average October rise since then has been 4.59%. Retail store closures in the retail sector are now running at more than 1,000 per month.
Housing hiatus
Housing starts so far this calendar year have averaged just 1,256,000 per month. That is down from 1,265,000 last year, and way below the long-term average of 1,429,000.
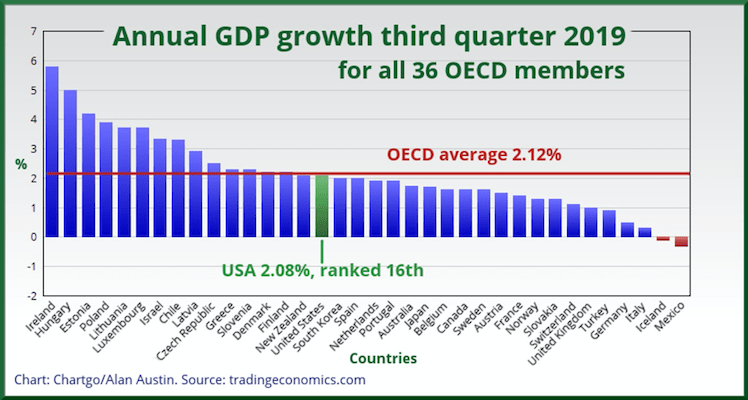
Economic growth
Annual growth in gross domestic product (GDP) in the third quarter of 2019 collapsed to 2.08%, from 2.29% in the second quarter and 3.11% a year ago.
Among the 36 developed countries comprising the Organisation for Economic Cooperation and Development (OECD) the US is in the minority which retreated in the third quarter. The US now ranks down at 16th in that group on economic growth.
GDP per person PPP
Despite having the world’s highest GDP, the US ranks only 12th in the world on GDP per person PPP, a handy measure of prosperity. The latest level is US$55,681 (A$81,023).
Troubling, however, is the rate of growth of GDP per person. The increase in 2018 over 2017 was just 2.2%. That ranks 86th in the world.
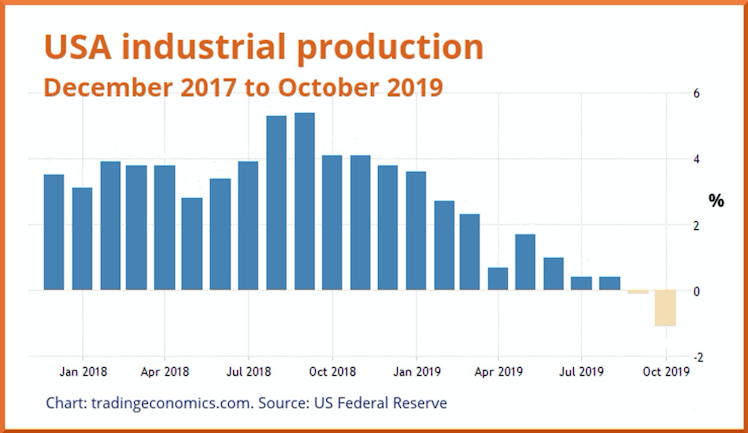
Industrial production
This critical productivity measure has declined in ten of the last 13 months, despite the global boom. Average growth over the first ten months of 2019 has been a dismal 1.16%. The long-term average is 3.72%.
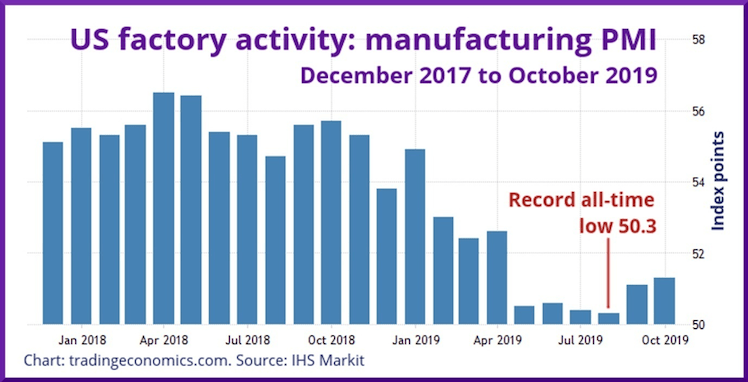
Factory activity
Measured by the manufacturing purchasing managers index, overall factory activity has declined severely since early 2018, reaching a new all-time low in August.
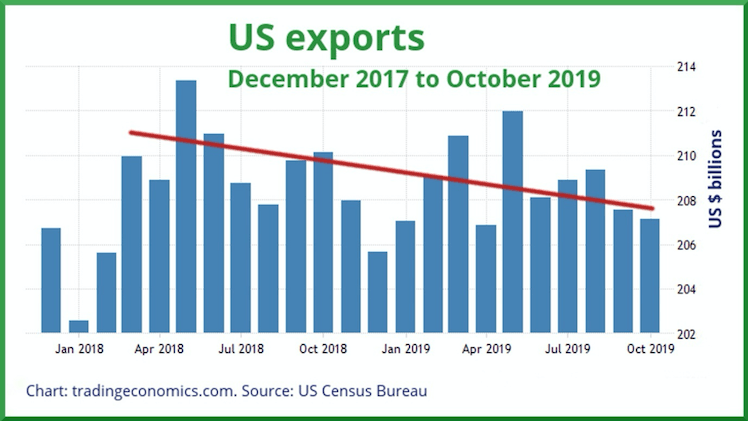
Exports
Exports should normally increase year on year as global population growth lifts demand for goods and services. Exports from the US have declined substantially since early 2018.
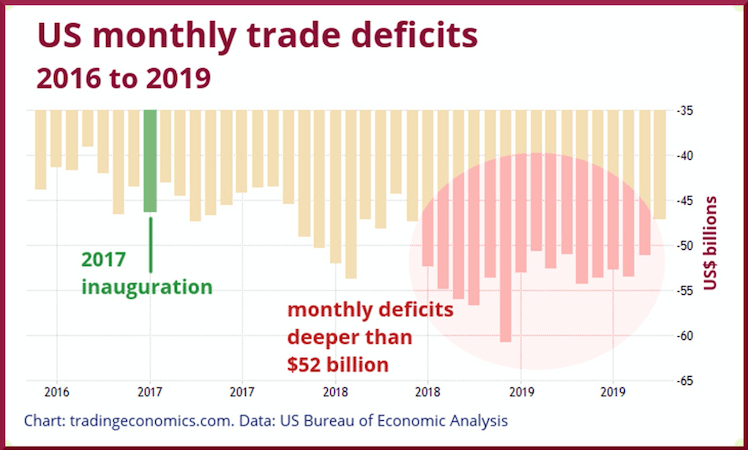
Trade deficit
The US trade balance plummeted to a deficit deeper than $52 billion (A$75.7 bn) in January 2018 after critical trade treaties were scrapped. This was the first time it had been this low since the 2008 recession. The trade deficit has remained deeper than $52 billion for 14 of the last 22 months.
The average trade deficit over the last 12 months of the Obama administration was $41.9 billion (A$61.0 bn).
Federal spending
Federal government spending over the 2017-18 financial year totaled US$4,109 billion (A$5,980 bn). This increased by 8.2% in the financial year just ended in September to $4,447 billion (A$6,470 bn).
Inflation over that period was just 1.76% and the population growth 0.60%.
Government revenue
Federal government revenue over the 2017-18 financial year totaled $3,330 billion (A$4,846 bn). That was just 81.0% of spending, down from 83.3% the previous year. Revenue only increased marginally to $3,462 billion (A$5,038 bn) in the year just ended, thus running at 77.9% of spending.
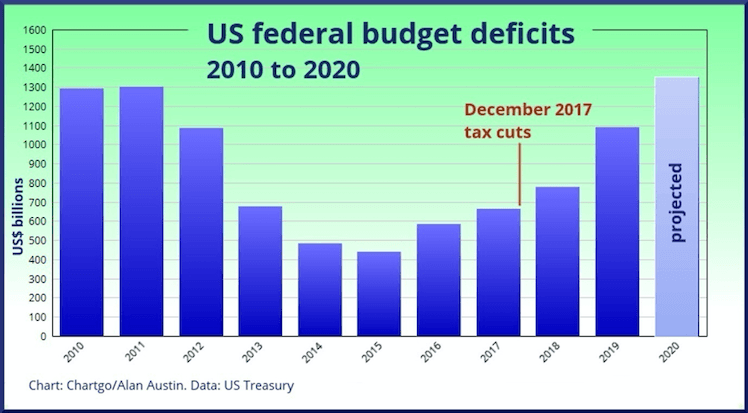
Budget deficit
The budget deficit for the year ended September 2019 was a staggering $1,091 billion (A$1,483 bn), up by 40% on the deficit of $779 billion (A$1,134 bn) last year, and almost double the 2016 deficit.
This contrasts with the claim by treasury secretary Steve Mnuchin in September 2017 that the tax cuts would slash the US budget deficit “by a trillion dollars”.
The US now ranks 125th in the world on budget deficits, and last in the OECD.
Government debt
Since the tax cuts, the federal debt has blown out by $2.6 trillion (A$3.78 tr) to $23.1 trillion (A$33.6 tr). The US now ranks 162nd in the world out of 171 countries on government debt to GDP and second last in the OECD.
Interest paid on the debt
Interest payable on the debt for the current fiscal year is budgeted at $618.2 billion (A$900 bn), 11.3% higher than last year. That is $4,320 (A$6,289) per US taxpayer. Every year, increasing each year.
Finally
Other variables were examined and found to have not shifted significantly or too early to call. These include productivity, private debt, poverty levels and the value of the US dollar.
The picture is quite clear and confirms findings elsewhere. Cutting taxes predominantly for the rich helps the very rich. But it does not help the economy.
———————-
Public support is vital so this website can continue to fund investigations and publish stories which speak truth to power. Please subscribe for the free newsletter, share stories on social media and, if you can afford it, tip in $5 a month.

Alan Austin is a freelance journalist with interests in news media, religious affairs and economic and social issues.