


Trump claims the US has a “roaring economy” which is now “the best it has ever been”. This is virtually the opposite of the truth. The economy is, in fact, performing as poorly as ever relative to the rest of the world. So let’s start the golf cart and assess progress down eighteen fairways by reference to official US departmental data.
Above average outcomes
Of the top 18 key economic measures, none is outstanding.
Average outcomes
Five variables are tracking about average. These are:
(1) Interest rates at 1.75% are on target. Unfortunately they are too low for retirees who had planned to live off interest income. But these are low interest rate times.
(2) Median wealth per adult increased over Trump’s three years from $55,881 in 2016 to $65,904 in 2019, a rise of 5.6% per year. Not bad. This ranked 22nd in the world in 2016, according to Credit Suisse, and 22nd again in 2019. [This analysis uses US dollars throughout, which currently = A$1.49.]
(3) Inflation is slightly higher than optimum at 2.3%, but down from 2.5% at Trump’s inauguration.
(4) The unemployment rate is now at 3.50%, down from 4.70% when Trump was elected. This is good historically, but nowhere near best. The jobless rate fell to 3.4% in 1968 under Lyndon Johnson. It dropped to 2.7% in 1952 and 2.5% in 1953 under Harry Truman.
The 1.2% reduction in Trump’s three years is better than the first terms of Reagan, Obama and the two Bushes, but not as good as the Clinton and Carter first terms nor the Clinton, Reagan and Obama second terms.
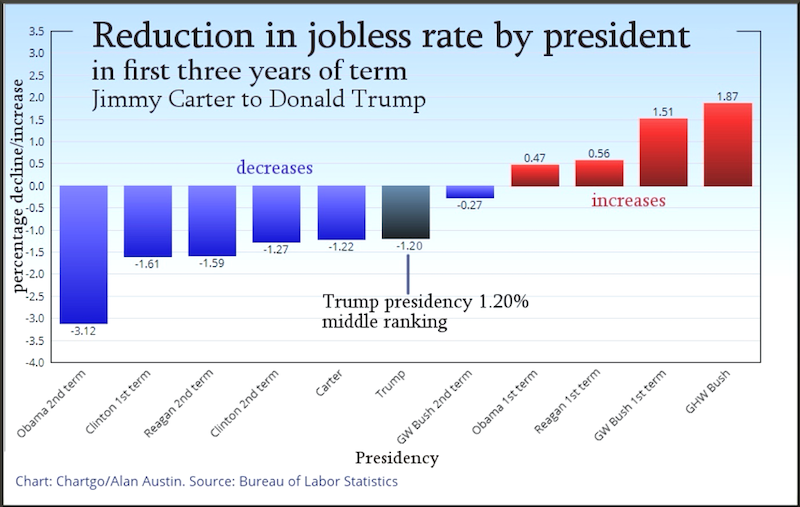
The US jobless rate today ranks 46th globally, so is not much above average. Buoyant global conditions have enabled many well-managed economies to reach all-time low jobless rates, not just 50-year lows.
(5) Youth unemployment is 8.1%, down from 9.8% when Trump took office. This is better than the global average, but below the leaders. The Netherlands, for example, reduced the rate over the same period from 9.8% to 6.6%. Germany now has this down to 5.8%, Japan at 3.8% and Switzerland at 2.4%.
Below average outcomes
The next five variables are poorly performed and represent significant failures by the Trump administration during the current strong global boom.
(6) The underutilization rate of workers in December was 6.7%, down from 7.5% a year earlier, but well above the jobless rate of 3.50%. The Bureau of Labor Statistics (BLS) defines this as the unemployed, plus those employed part time who want more hours, plus persons marginally attached to the labor force.
(7) Wages growth has proceeded barely ahead of inflation since Trump’s election. The BLS recorded an increase of 2.48% in 2017 to $22.31 per hour. Inflation was 2.1%. Wages then rose 3.50% to $23.09 per hour in 2018, while inflation stayed at 2.1%. The rate increased 3.03% to $23.79 in December 2019, while inflation fell to 1.9%.
It is impossible to measure accurately whether these puny wage increases are shared across the community or skewed towards high income earners.
Trump asserted on Tuesday that
“Since my election … wages are rising fast — and, wonderfully, they are rising fastest for low-income workers, who have seen a 16 percent pay-increase since my election. This is a blue collar boom.”
That is nonsense. There is no evidence for that anywhere apart from vague media claims attributed to global tax evasion consultants Goldman Sachs.
(8) Annual GDP growth for the 2019 fourth quarter came in at a lowly 2.32%. This now ranks 104th globally, the lowest on record.
(9) Retail and wholesale trade are paying the greatest price for Trump’s failed economic policies. Hundreds of retailers have gone bankrupt since his election, with new foreclosures announced each month. The total loss of retail jobs is now 65,400. The wholesale sector has fared even worse, losing 165,000 jobs since 2016.
(10) The housing index measures the percentage increase of house values and usually shows an appreciation just above inflation. The average for the last eight years, since the end of the global financial crisis (GFC), has been 0.48% per month. Through 2019, however, this has slipped back to 0.36%, the lowest since the GFC.
Disastrous outcomes, close to world’s worst
The next eight variables have been appallingly bad, the more so when matched against lofty Trumpian promises of winning, more winning and winning until we are sick of winning.
(11) The decline in exports over the last 19 months highlights the monumental failure of Trump’s trade wars. Exports for December reported this week reached just $209.6 billion. That is lower in real terms than the $205.7 billion achieved in December 2018 and even further below the $206.7 billion number for December 2017.
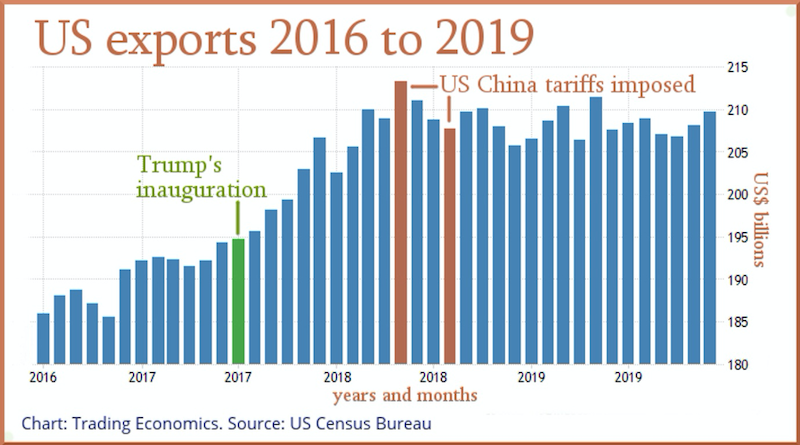
Exports for the last six months of 2019 average just $208.1 billion. This is lower than the first six months of 2019, lower than the last six months of 2018, and lower even than the first six months of 2018. Trump’s trade deals have yielded no benefits whatsoever.
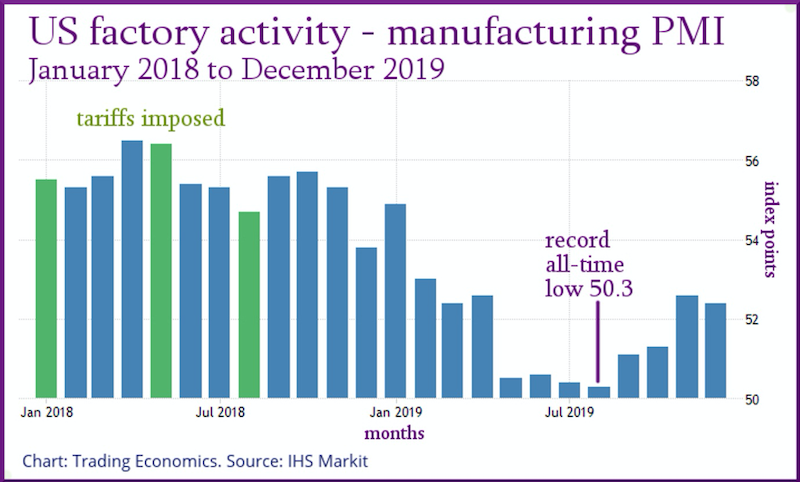
(12) Manufacturing declined immediately Trump imposed steel tariffs in May 2018, and reached an all-time low last August. The recovery has begun now Trump has abandoned his disastrous tariffs, but has a long way to go.
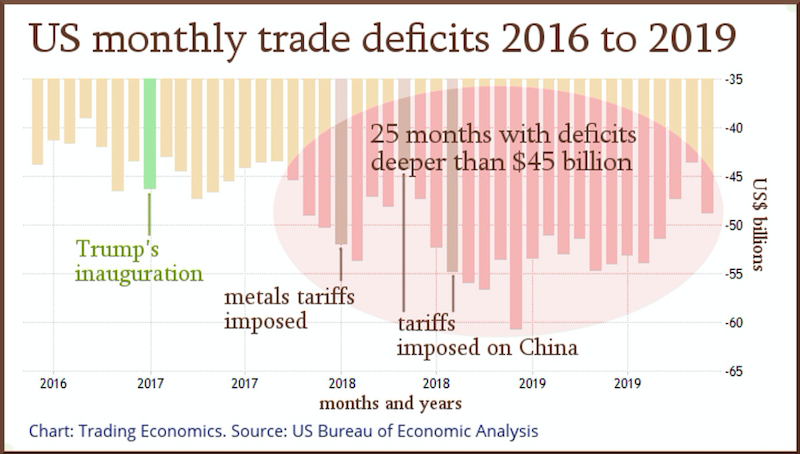
(13) The US trade deficit deepened on Tuesday to -$48.9 billion. Over the last 27 months, this has been deeper than $45 billion 25 times. It got as low as $60.8 billion in December 2018. The average for the last eight months is $50.9 billion. The average over President Obama’s last eight months was just $40.7 billion.
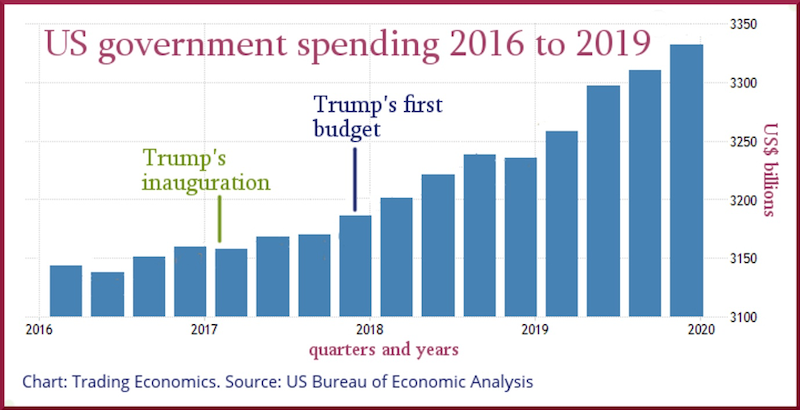
(14) Government spending has increased by 15.4% over Obama’s last budget in 2015-16, to a thumping $4,446.6 billion in 2018-19. It is still rising uncontrolled.
(15) Government revenue declined in real terms per person in the last financial year from the year before. Revenue came to just 77.9% of spending last year. It is currently running at an unsustainable 69.3% of spending.
(16) The budget deficit came to $984.4 billion last financial year. That is 68.3% higher than the 2015-16 deficit of $585 billion. This is tracking even deeper so far this year, heading towards -$1,045 billion.
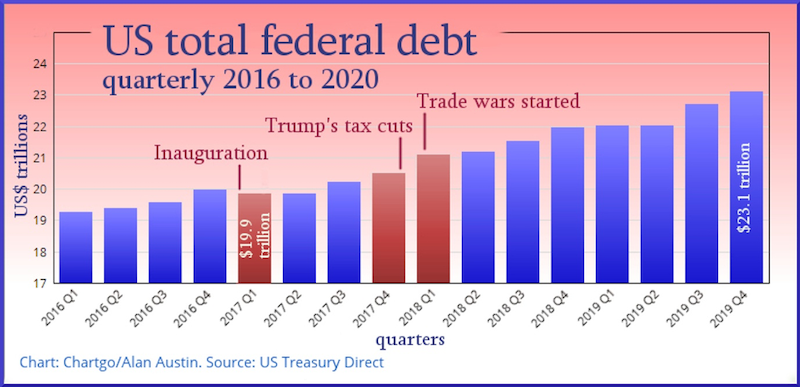
(17) Federal government debt is up $3.3 trillion since Trump’s inauguration to $23.25 trillion.
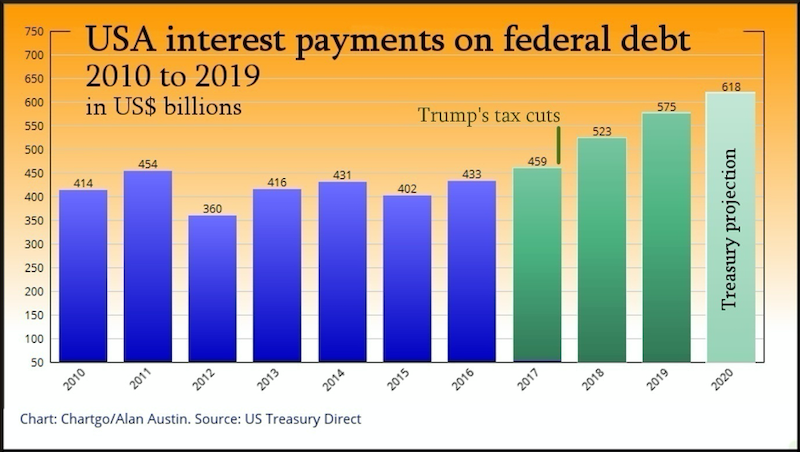
(18) Interest on the debt is budgeted at $618.2 billion this year. That comes to $4,370 for every US taxpayer. They just don’t know it yet.
So, that is our 18-hole course of key economic variables. The scorecard is pretty dismal. Trump has duffed most tee-shots into the rough.
—————————-
Trump just told a global forum that “America is winning again like never before”.
The opposite is true. The hard data shows the US economy is further down the rankings of sound management than ever.
Please read and retweet. It’s free. https://t.co/zKkjRxY5yI via @MichaelWestBiz— Alan Austin (@alanaustin001) January 22, 2020

Alan Austin is a freelance journalist with interests in news media, religious affairs and economic and social issues.